Blog

Uncategorized

The Muscle, the Ridge, and the Wardrobe

Finally! Something new to talk about from my post-doc!

While it has been quite a struggle to juggle projects these past months, I have been able to submit and recently publish a study I have been intrigued about for several years already. Back in 2016 during a dissection of a tapir (see here), I noticed a peculiar morphological feature of the tapir shoulder muscles. Remarkably, it took six years to circle back to this osteological oddity thanks to an opportunistic dissection trip to the USA. The resultant study has now been published in The Anatomical Record, and you can read the paper here (or ask for it on ResearchGate).
Here’s how it all played out…

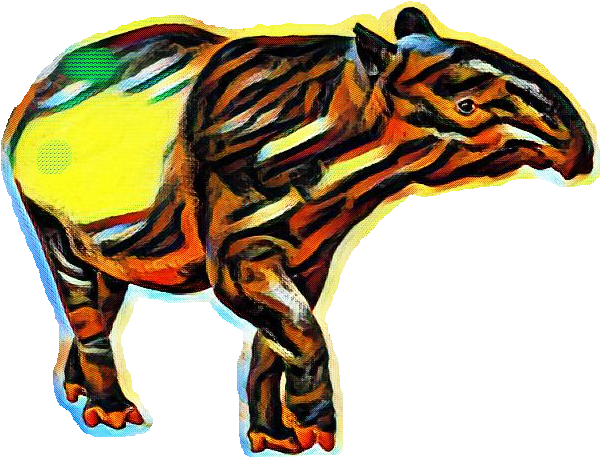
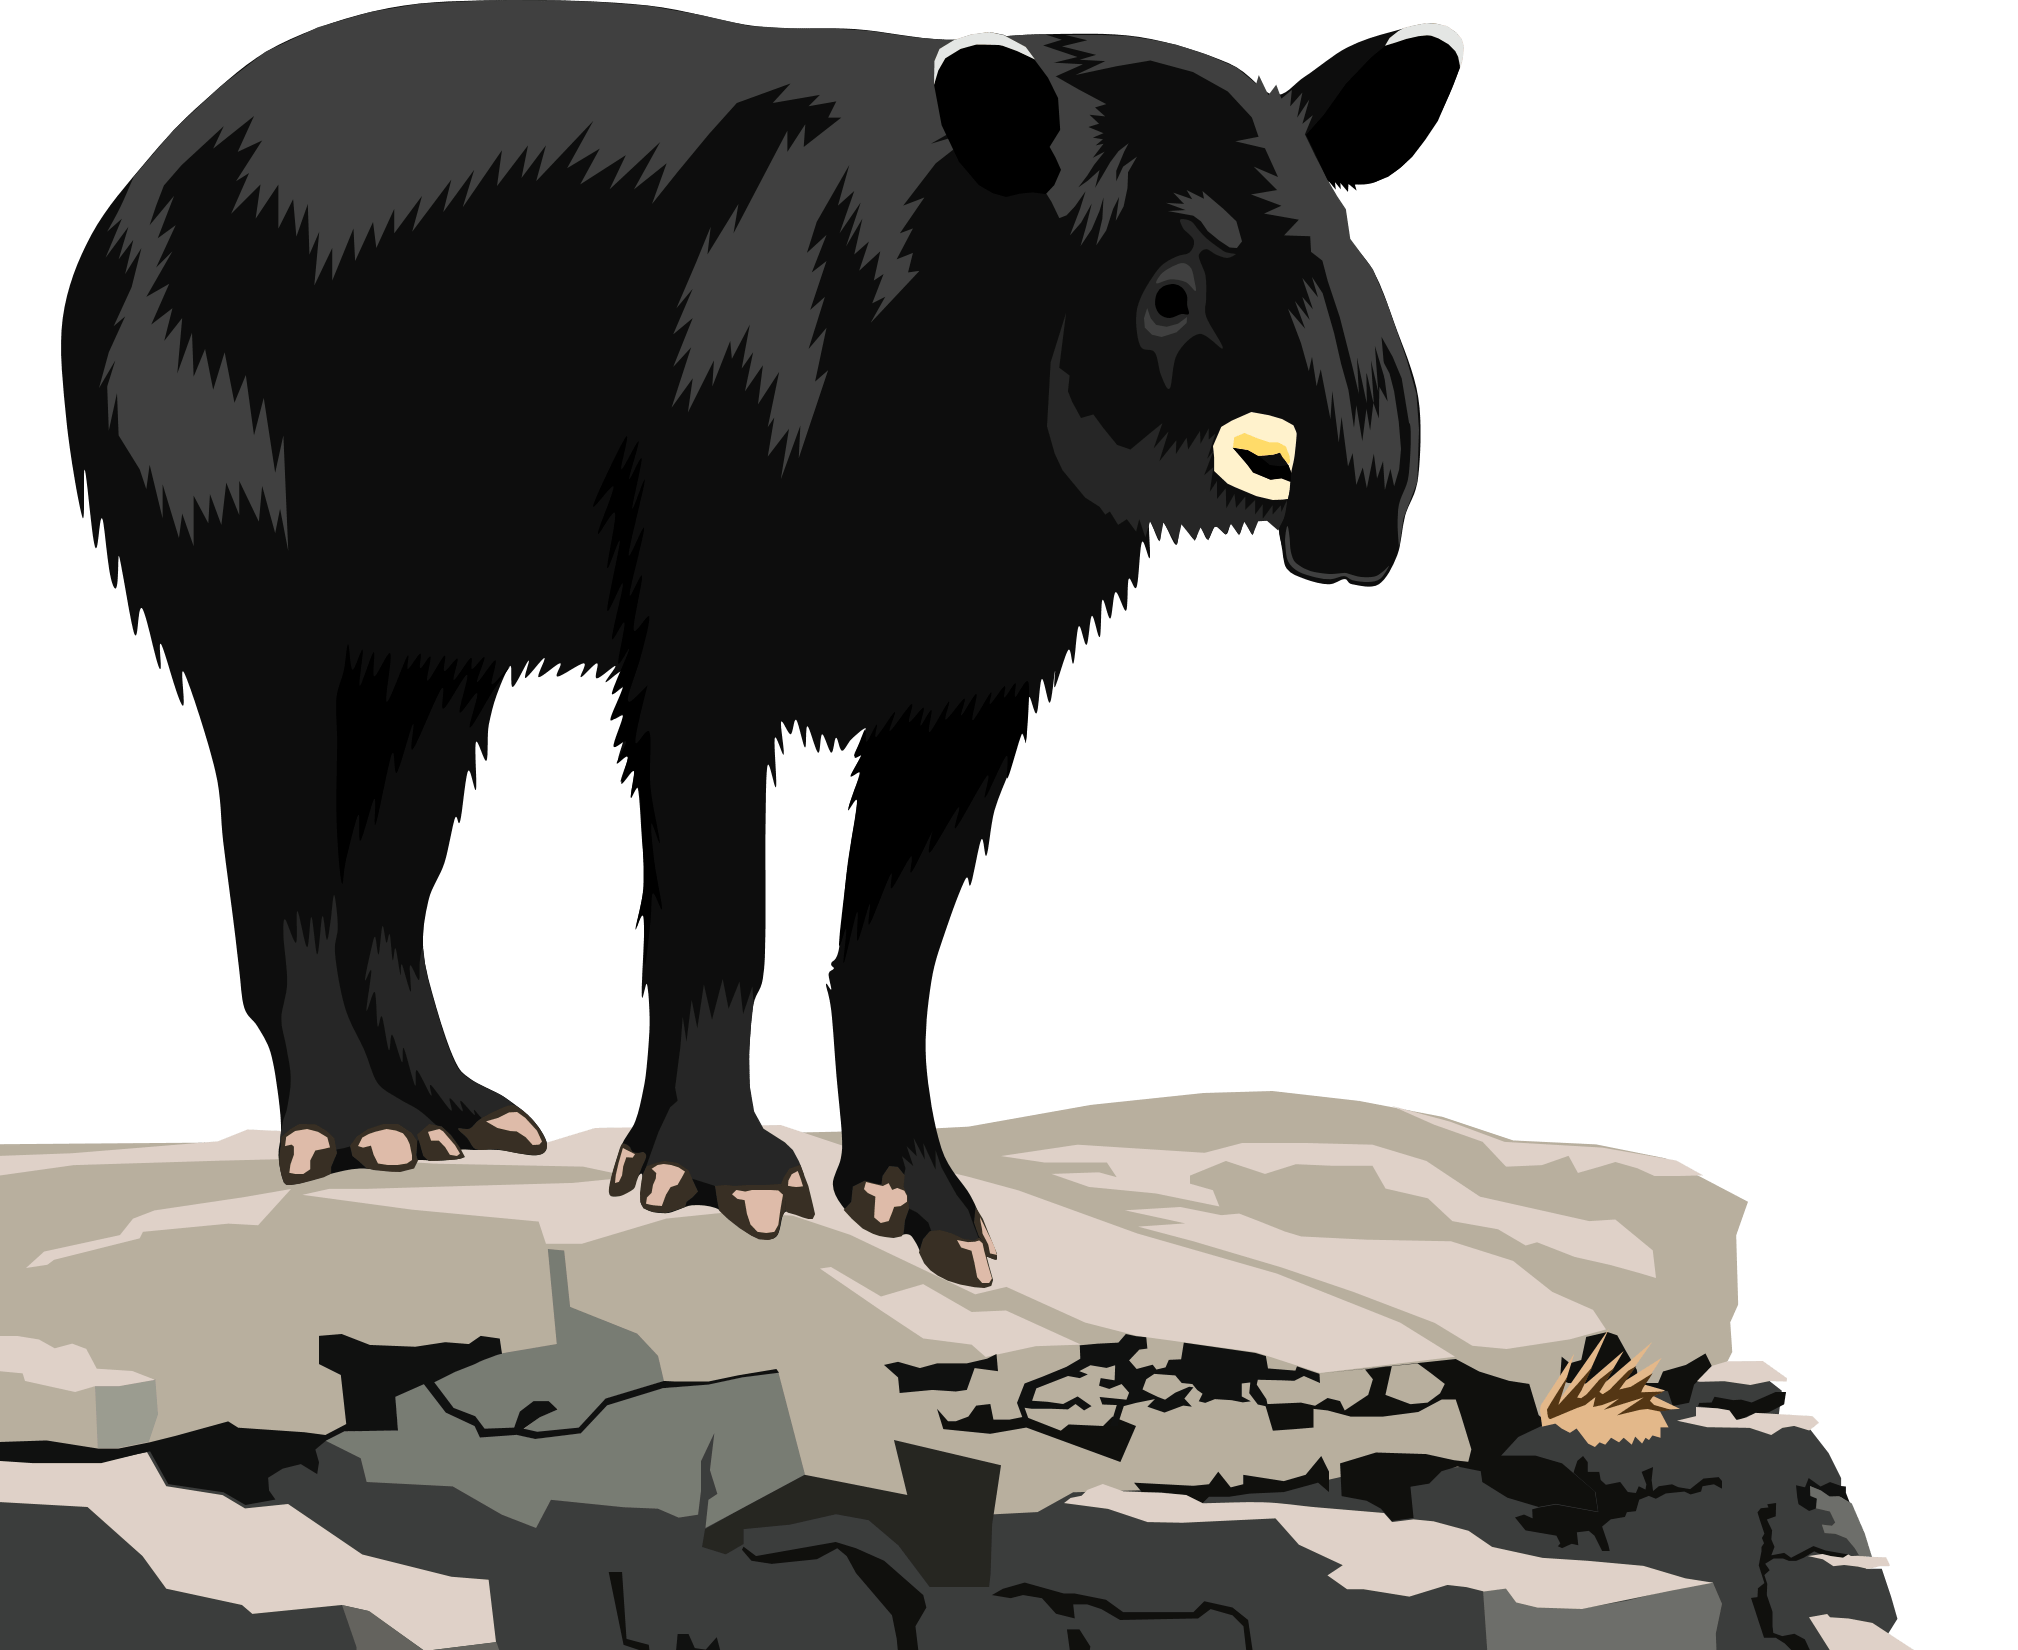
For over 50 years it has been known that the Malayan tapir (Tapirus indicus, the black-and-white one!) have muscles in their shoulder which are arranged slightly differently to other species of mammals – especially compared to their close living relatives, the horses and rhinoceroses. Not much is known about the musculature of other species of tapir, with only a few studies ever performed. And worse, the descriptions in those few studies do not line up with one another! So a tricky starting point! Back in 2020 I published a quantitative description of the forelimb muscles of the Malayan tapir (MacLaren & McHorse 2020). During that study my co-author Brianna McHorse and I confirmed the presence of a peculiar ridge on a feature of the scapula (the shoulder blade). The feature in question is called the scapula spine; this is a large, mostly flat piece of bone which arises perpendicular to the main “blade” of the shoulder-blade. On each side of the scapula spine there is a large muscle – one is called the supraspinatus (meaning “above the spine”), and the other is called the infraspinatus (meaning “below the spine”). These muscles attach to the scapula and connect it to the humerus (the upper arm bone) – both these muscles act as stabilising muscles in hooved mammals (such as tapirs, horses, cattle etc.). The peculiar thing about tapirs is the shape and location of their infraspinatus muscle, and the effect that has on the bony material of the scapula itself.

As mentioned above, ‘infra’ quite literally means ‘below’, and most self-respecting quadrupedal mammals have their infraspinatus muscle nestled in the section of their scapula which is below the scapula spine. This section is called the “infraspinous fossa” [a fossa, in this anatomical context, is a shallow depression in a bone – not to be confused with the Malagasy fossa, a carnivorous mammal made famous by the film Madagascar!]. The infraspinous fossa is normally the origin site for the infraspinatus muscle – and unsurprisingly, the supraspinous fossa is the origin site for the supraspinatus muscle. With me so far? Nothing weird yet, right? OK – enter: tapirs.

Left scapula (shoulder blade) of Tapirus indicus (left) and Tapirus terrestris

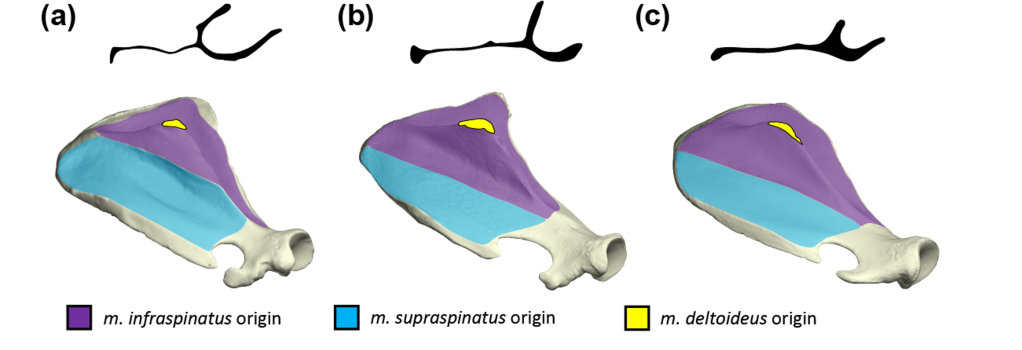
Tapir scapulae are universally weird. They have a substantial notch (a hollowed out section) just above the shoulder joint – sometimes the ligament which normally passes over this notch becomes completely ossified, forms a bony bridge, and then the tapir literally has a hole in its shoulder-blade! [see figure above] This phenomenon has not been documented in any other mammals other than great apes, and the shape of the tapir scapula is consequently quite unique among hooved mammals! And then there’s the supraspinous fossa. Tapir supraspinous fossae are very large relative to the infraspinous fossa, especially when compared to those of other living perissodactyls (horses and rhinoceroses) and most hooved mammals (including giraffes, antelope, pigs, etc.). Moreover, the supraspinous fossa of most tapirs sports a low ridge running from approximately the start of the scapula spine and ending at the dorsal margin of the scapula, roughly bisecting the supraspinous fossa. The ridge lies in the supraspinous fossa, so I used my imagination and decided to call it the “supraspinous ridge” [catchy, I know…]. THIS is the feature which stands out in my recent publication, for a couple of very good reasons.

Comparison of areas of the scapula which are attachments for the infraspinatus, supraspinatus and deltoideus muscles. (a) Malayan tapir, Tapirus indicus; (b) lowland tapir, Tapirus terrestris; (c) mountain tapir, Tapirus pinchaque. Cross-section silhouettes (top) show notable peaks coming off the surface of the scapula, representing the supraspinous ridge morphology.

The supraspinous ridge has not been described before – it has been mentioned in passing, but not specifically described or compared across species. The purpose of my recent paper, therefore, was (1) to find out which tapirs showed a ridge, (2) what the ridge represented, and (3) whether there is any perceivable functional driver behind the presence of such a ridge. So let’s start at the beginning: who has a supraspinous ridge?

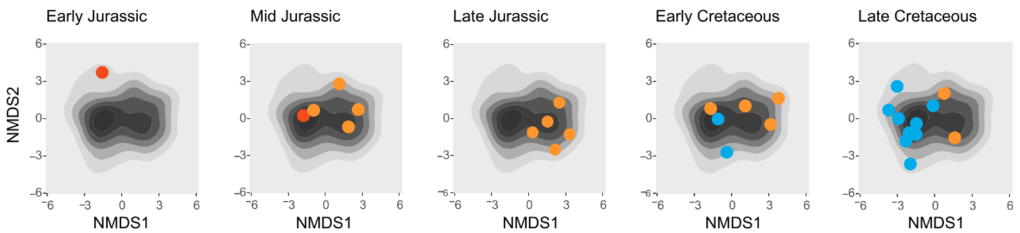
Within modern tapirs, I found that there was a clear supraspinous ridge in all species, but with a clear difference between the shape and placement of the ridge between the Malayan tapir and the three Neotropical species (lowland, Baird’s and mountain tapirs)*. The Malayan tapir supraspinous ridge pokes out from the scapula spine, whereas Neotropical species have the supraspinous ridge in the centre of their supraspinous fossae. Do already there is disparity in ridge expression. When I looked at extinct species, I found that all extinct New World tapirs exhibit the same ridge condition as modern New World tapirs – quite different to the Malayan tapir. When I looked further back in the fossil record, it seems that all tapir species which do not belong to the crown genus “Tapirus” do not show evidence of the supraspinous ridge. [There was tantalising evidence for the condition in the very early tapiroid ‘Hyrachyus’ (from the Messel pit in Germany), but it could not been confirmed in this study]. Since the scapula spine and ridge morphology only seems to be present in the genus Tapirus, and appears with two distinct and consistent morphologies, I think this could be used as a character for helping to work out family relationships between tapirs – a mission which is in urgent need of undertaking! It will be very interesting to see whether this trait is indeed useful for such a task, and I look forward to finding out in the future!

A simplified phylogenetic tree of the tapirs and relatives used in this study, with the colours defining which species have a supraspinous ridge and what morphology it shows (key bottom left).
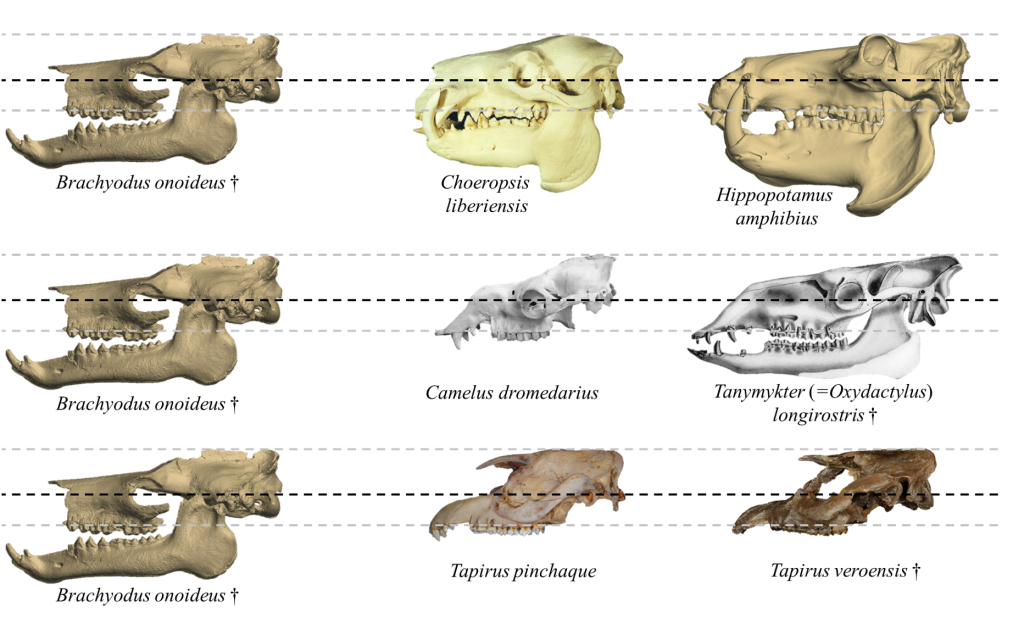
A species with † means that the species is extinct.

*small aside on the number of modern tapirs – there is some evidence for a fifth species (Tapirus kabomani), although the jury is still out somewhat on the validity of this species. The topic is covered nicely by Dr. Darren Naish in his TetZoo blog post, and I will leave the reader to read that post and decide their thoughts on the matter!

Ok, so I established which species exhibit the ridge, but what even IS the supraspinous ridge? Clues to the cause behind the ridge expression in tapirs could be found during comparative dissection, and as part of this study I was fortunate enough to take part in several! Comparative dissection of the shoulder region demonstrated that the infraspinatus muscle actually passes over the scapula spine (rather than originating only within the infraspinous fossa) and attaches on the supraspinous side of the scapula spine. In Malayan tapirs, the infraspinatus attaches on the scapula spine, whereas in the two Neotropical tapirs I studied (lowland tapir T. terrestris and mountain tapir T. pinchaque) the infraspinatus passes all the way over the scapula spine and attaches on almost 50% of the supraspinous fossa! The supraspinous ridge marks the border between the attachment sites of the infraspinatus and the supraspinatus muscles, otherwise known as the “epimysial border”. Thus, the supraspinous ridge of tapirs represents a very reliable osteological correlate for the location and presence of the supraspinatus and infraspinatus muscles. But what selective advantage would this change in muscle attachment actually present for Tapirus species?

Comparison of a shoulder of Tapirus bairdii (Central American tapir) with the attachment area of the infraspinatus muscle on the scapula (origin) and humerus (insertion), plus the line of action of the muscle drawn in (very roughly!!). The small yellow line highlights the distance from the rotation centre to the line of action. Using this simple diagramatic approach, you can see that the infraspinatus muscle originating partially from the supraspinous fossa (left image) has a smaller distance from the line of muscle action to the centre of the joint (0.70 units) compared to the muscle originating only from the infraspinous fossa (right image, 0.82 units). The proximity of the line of action passing through the joint centre offers more stability to the joint – however, the difference is quite minimal.

In truth, this is where I am forced to speculate. The reality is that the shift in muscle attachments at the shoulder would not have conferred any great advantage from a biomechanical point of view, although it might be beneficial that the line of action of the infraspinatus muscle passes directly through the centre of the shoulder joint. At this point, I am truly baffled by the peculiar placement of the infraspinatus in tapirs. In my paper I speculate that this may be an adaptation for shoulder stability which is unlike that evolved in other hooved mammal species; the shoulder anatomy of the ancestor of Tapirus shifted, but that shift did not necessarily bring any specific advantageous (nor deleterious) effects on the locomotion of the group.

For now, I have chalked this one down as yet another enjoyable journey into the bizarre morphology of a wonderfully weird group of animals, and I hope to find out more about them during the remainder of my postdoctoral project!

Publication, Uncategorized

Palaeotheoryum Presents: All the better to eat you with?

Time for something different! As any regular readers of this very irregular blog will be aware, I mostly post about my own studies and make an effort to break down the more complex scientific jargon (which I insist on using in papers) and make it more accessible for non-scientists. Feel free to post a review on how well (or poorly) I am managing!
Anyway, recently I have been contributing to some really interesting studies – particularly coming out of the University of Liège ‘Evolution and Diversity Dynamics Lab’. I assisted with several of these studies mostly at the scanning and writing phases, but I want to share the work of these excellent scientists with you all through their own words. Thus, in a break with the ordinary Palaeotheoryum protocol, here is my first attempt at a review/interview for my colleague’s work! Palaeotheoryum Presents: teeth!

The first study I am going to showcase is hot off the press, published in Proceedings of the Royal Society B: Biological Sciences in September 2022! This paper, part of a multinational endeavour with authors from six countries scattered across the world, brings together morphology, function, ecology, and 3D digitisation to investigate tooth shape and feeding strategy in marine amniotes (mammals and reptiles). Coordinated by the EDDy Lab, the study specifically investigates the variety of shapes, sizes and surface complexities of marine amniote teeth using high resolution 3D scanning and high density geometric morphometric tools, combined with gut contents and other feeding behavioural proxies. I caught up with lead author Professor Valentin Fischer to ask him about the project.

Professor Valentin Fischer using his great height to scan the tricky bits of a mosasaur skull in the display halls of the Royal Belgian Institute of Natural Sciences, Brussels. Image by Jamie MacLaren.

First up – let’s get some context for this study. Within the broader EDDy Lab umbrella, this 2022 study encompasses digitisation methods, pioneers analytical techniques, and focuses on study organisms central to the lab’s recent projects: 3D scanning and geometric morphometrics of marine amniotes. Now, that’s all very well and good, but why teeth? “Teeth are my favorite part of the skeleton!” Valentin elaborates – maybe he is secretly a mammal-worker after all! “Despite their simplicity – in many marine amniotes, at least – they encapsulate so many different signals.” The utility of teeth as a tool used by marine organisms to capture, process, and interact with the surrounding environment, both biotic (e.g. puncturing food) and abiotic (e.g. straining water), makes them fascinating subjects for large scale ecological study. However, the capability for EDDy Lab researchers to capture the full range of tooth variation exhibited by marine amniotes should not be overlooked. “Thanks to the high-precision surface scanners in my lab (both laser and structured-light based)” Valentin continues, “we have accumulated a huge collection of 3D models of marine amniote skulls, jaws…and teeth!

The study was in part inspired by the qualitative works of Judy Massare, whose seminal research assigned feeding guilds and inferred behaviours about extinct species, especially marine reptiles. The works mostly focused on the features of tooth shape, including the presence of ridges and small serrations. “We explicitly analyse tooth size and orientation, in addition to shape“, Valentin elaborates with growing excitement, “and we also provide a new, repeatable, and quantitative protocol to infer feeding palaeoecology“. The protocol Valentin refers to incorporates a semi-automated landmark-based shape assessment, plus an additional “topographic complexity” component (i.e. we looked at overall shape AND the details on the tooth surface). This procedure is detailed below, a figure used in the article itself!

Brief flow-diagram of the protocol as performed on marine reptile dentition, adapted from Figure 1.

It would be fair to say that the project was not without its challenges, especially given the scope of the sample collected. When asked what the most challenging aspect of the study was, Valentin’s answer was hardly surprising: “Getting enough 3D models during COVID, really!” – as a contributor to that large sample of teeth I can confirm that the biggest headache was specimen availability and accessibility, and a big thank you must go out to the museum collection managers, researchers and collectors who helped us achieve our impressive and highly informative sample. The 3D models of the teeth used in the study are now all freely available online at the Morphosource project “Fischer et al 2022 Proc B – marine amniote teeth”, project ID: 000435369

Arguably one of the most interesting aspects of the study was the simplicity of the results – something which came as no surprise to lead author Valentin Fischer: “I do not like to overhype science and eureka moments… so I’ll be fully honest and say that I somehow expected most of the results we obtained!“. The repeated evolution of simplistic cone-shaped teeth has been noted in previous qualitative and quantitative studies of marine amniotes, but this has never truly been demonstrated across a large sample of clades using three-dimensional shape analyses combined with tooth size and surface complexity. “[The results] seemed sensible and logical, which is a calming feeling for someone initially trained in bone anatomy and systematics” continues Valentin, who has long been interested in marine reptile morphology, relationships, and evolution.

Excerpt from Figure 3 of the paper, demonstrating the morphological constraint of the larger teeth in the top left of the screen (x -axis = principal axis describing shape; y-axis = size).

Our hope is to help pushing forward the field of marine amniote palaeoecology with explicit incorporation of tooth size and orientation, within a quantitative canvas.” muses Valentin, referring to the methodology put forward in the paper. “This [paper] somehow solves a long-standing conundrum, where animals with similarly shaped teeth were found with clearly distinct gut contents“. One of the great benefits of high-density three-dimensional geometric morphometric approaches is the ability to differentiate very subtle differences between superficially similar objects – assuming one has good resolution data which are not overly damaged! The acquasition of such a sample in a global pandemic was (understandably) problematic, and when asked what the most challenging aspect of the study was, Valentin replied in no uncertain terms: “Getting enough 3D models during COVID, really!

Finally, I asked Valentin what he sees as the next steps for using this method within the EDDy Lab. While he is very keen for other labs, independent researchers and alike to all try out this method on their own groups of organisms, Valentin certainly has some ideas which he is keen to explore, based around his own research and ongoing projects. “Analysing shape disparity in Iguanodon thumb spikes [as part of the multidisciplinary Iguanodon 2.0 Heritage Science project], belemnite guards, and shark teeth” – watch this space for more fascinating (and high-density) research coming from Liège and collaborating institutions!

The enigmatic “whorl-toothed shark” Helicoprion attacking small cephalopods (which could be belemnites!).
Image by Steve White.

The article is available now online from Proceedings B website, or contact myself or any of the other authors on ResearchGate (e.g. me!) to access it if you cannot get it through your university or institution. A lot of hard work went into the generation and streamlining of the method, and we are all really proud that it could be applied to such a fascinating group of animals.
We all look forward to seeing what the rest of the scientific community does with the method, and what intriguing questions can be answered!

[cover image by A. Gennari – support palaeoartists!]

Publication

Mosasaur ecomorphology at world’s end

Finally! After finishing my contract almost a year ago, I can at least reveal the first work I spearheaded as part of the SEASCAPE project at the Université de Liège EDDy Lab. Although it has been a long time coming, I remain very happy and proud of this work, which combines morphometrics, 3D modelling, and disparity – all hallmarks of the EDDy Lab. In our latest contribution, we investigated the final ~15 million years of mosasaur evolution, exploring cranial functional morphology across local and global scales.

Quick recap: mosasaurs were the dominant marine reptiles during the final part of the Cretaceous (83-66 million years ago). [I digress – technically we should call them mosasaurids, but we will keep it at mosasaurs for the purposes of this blog] Most closely related to snakes and lizards (within the order Squamata), mosasaurs first arose in the Cenomanian (c.95Mya), but it was not until the Turonian/Santonian that they truly rose to dominance and occupied numerous trophic levels in Mesozoic marine ecosystems. Examples include the eponymous taxon Mosasaurus – made famous by George Cuvier in the early 1800s before being made way too big in Jurassic World franchise(!) – and Tylosaurus, the “ram-nose” mosasaur, which in all likelihood did NOT have a soft-tissue crest all along it’s back as many of my prehistoric animal books would suggest as a kid! Along with Platecarpus, another one of the earliest marine reptiles I remember learning about when I was a child, I was to meet all these beasts face-to-face many years later as part of the data collection for a study on mosasaur functional morphology.

Paleoartistic representations of arguably the most famous mosasaurs (certainly from my childhood!).
From left: Mosasaurus (©Jonathan Kuo); Tylosaurus (©Henry Sharpe); and Platecarpus (©Henry Sharpe); 3D models rendered from scans taken during this study

Now, most of us have heard about the extinction which wiped out the non-avian dinosaurs 66 million years ago; however, few among us know how the morphological diversity of life was changing prior to that event in non-dinosaurian groups. For example, the diversity and variation in the dominant marine reptiles of the time – the mosasaurs – has only recently started to come to light, first in a feeding and locomotion study from my former university in Bristol (see Cross et al. 2022), and most recently in an in-depth study by myself and colleagues at the Université de Liège, out now in the Proceedings of the Royal Society B: Biological Sciences.

Our aim was to establish how ecomorphologically diverse mosasaurs were when they died out at the end of the Cretaceous, and whether we could explain patterns of diversity or disparity (i.e. diversity in form/function) in the lead-up to the end-Cretaceous mass extinction. To do this, we used a series of high-definition laser and structured-light scans to build 3D models of the skulls of mosasaurs, which we then supplemented with images and measurements from literature sources and first hand photos from “pancaked” specimens. [yes, that’s the term we have coined for specimens which have been fossilised in a near-flat condition!]. Sometimes, I was able to scan pancaked specimens and then reconstruct a life-like skull from that flattened fossil; several of these recontructions were made in order for us to maximise the amount of data we could get from all the different species.

Here is a snapshot of a former work-in-progress where I took a scan from a pancaked mosasaur (Plesioplatecarpus planifrons FHSM VP 2116) and reconstructed it in a much more realistic, life-life position. The original tweet can be found here; note the ongoing discussion on the placement and orientation of the quadrates in these animals!

Within the study, we recorded a series of linear measurements on complete and near-complete skull and dental material from an unprecedented sample of mosasaurs (93 specimens covering 56 species). These linear measurements were used to calculate ratios (often called “functional traits”) which pertain to specific mechanical or sensory outcomes. For example, the length of the mandible from the anterior extremity (i.e. the front of the snout) to the articulation with the cranium can be considered the out-lever for calculating the mechanical advantage for jaw adduction. A similar measurement from the mandible-cranium articulation to the centre of adductor muscle insertion (in this case, the centre of the coronoid process of the mandible) represents the in-lever for mechanical advantage – the ratio of the in-lever to out-lever thus provides a biomechanically-rooted characterisation of jaw addution (i.e. biting). Traits we incorporated included the mechanical advantage of jaw closing and opening; the aspect ratio of the buccal cavity (representing a proxy for the volume of water displaced during jaw addution); the relative depth of the dentary in the middle of the toothrow (representing a proxy for the flexural stiffness of the part of the jaw involved in food processing); and the curvature of the teeth. All combined with characterisations of certain sensory features (e.g. relative orbit size; narial retraction; relative size of the pinneal foramen; etc.), we were able to generate a suite of 16 features which described the ecomorphology of the mosasaur skull – this data could then be processed to generate ecomorphological disparity estimates for discrete time bins and geographical regions.

Examples of measurements taken on a lateral image of Prognathodon solvayi (IRSNB R 33b); image taken from the paper

During our study, we were able to demonstrate (far beyond reasonable doubt) that the last mosasaurs i.e. those present in the Late Maastrichtian (c.70-66 Mya) actually exhibited a different range of ecomorphological characteristics by comparison to those that preceded them. The mosasaurs in the Late Maastrichtian presented a different ‘macroevolutionary landscape’ topology; that is to say, the density of phenotypes (i.e. accumulation of species within a given ecomorphospace) exhibited a very different pattern in the species present in the last throws of the Mesozoic. This ‘landscape’ indicates that mosasaurs in the Late Maastrichtian predominately fall into one of two broad ecomorphological categories:
MEGAPREDATORS – generally large species with deep jaws for resisting bending during biting, sturdy teeth, and relatively large areas for jaw adductor [closing] muscles to produce powerful bites!
GRASPERSthough personally I prefer the accurate but slightly ambiguous termSUPER-SENSORS! – small-to-medium sized species with strongly curved teeth, relatively large orbits, large pineal foramina [= large ‘third eye’], relatively slender jaws, and a large tympanic fossae in the quadrate.

Imagine an island of commonly exhibited phenotypes in a sea of non-existant (or very rarely expressed) morphologies. I realise that this, conceptually, is quite hard to imagine!
Now check out the figure above and try again. The largest peak – the light green island – represents the ‘megapredatory’ ecomorphological phenotype just before the K/Pg mass extinction – there is a high density of species with similar functional morphology, represented in the figure by the European tylosaur Tylosaurus bernardi (based on IRSNB R 23). The smaller peak – the slightly darker green “island” – represents the species exhibiting ‘grasping’ ecomorphological traits, with their accompanying suite of sensory characteristics. The example of such a species is Plioplatecarpus (based on TATE V0087).
Figure adapted with permission from MacLaren et al. 2022; © Jamie MacLaren

These two main groups present in the Late Maastrichtian consisted of a phylogenetically diverse assembly of mosasaur species, indicating repeated evolution of similar ecomorphologies in divergent lineages – essentially, multiple different groups undergoing similar selective pressures (maintaining hydrodynamic efficiency, capturing suitable prey, etc.) came to the same functional “conclusions” by way of their cranial morphology. In some cases, in different geographical areas, the variation in functional morphologies exhibited at any one time indicated large-scale shifts in mosasaur community composition – this is where our novel population ecology approach really helped us to see what was going on at global and regional scales

Without getting too much into the maths of the method, our approach to assessing ecomorphological disparity was inspired by the principles of biodiversity quantification. Allow me to explain! In its simplest form, the diversity a localised population within a broader community can be described by its “alpha-diversity” – a count of the species you find in the population (e.g. number of different species of fish in each of the Great Lakes). If we take a step back, look at diversity across a larger geographic scale, we are presented with the “gamma-diversity” for the group (e.g. number of species of fish in The Great Lakes as a whole). Now if we want to understand the diversity of local populations in relation to the larger population, for the purpose of quantifying the differentiation of diversity, we would divide the gamma-diversity value by the mean-average alpha-diversity value across all the populations (e.g. all the individual Great Lakes) to give a value for “beta-diversity“.
Taking these principles for establishing differentiation, we took the approach and applied it to mean disparity values (as calculated from 1000 bootstrap replications), providing us with values or alpha-, gamma-, and beta-disparity respectively. [I like to call them collectively “Greek disparity”, for rather obvious reasons!]. For any disparity queries, all the details are in the paper and the supplement – but rest assured we took the precaution of performing disparity calculations with multiple different disparity metrics (sum of variance, pairwise dissimilarity etc.), and we recovered the same results for all of them, which was reassuring and nice!

Here’s a simple schematic of how population diversity (and disparity) can be partitioned and calculated.
In this example, three different time bins (Time 1, Time 2, Time 3) are presented with arbitrarily generated data for each of the populations. Hopefully this give a quick and simple overview of how “Greek disparity” was calculated in this paper.


Using our “Greek disparity” approach, we were able to demonstrate that mosasaur communities in the Campanian and Maastrichtian were not geographically similar, and by the Late Maastrichtian communities were either ecomorphologically diverse and stable, or declining and becoming more ecologically homogeneous. At the risk of giving the whole game away, I won’t divulge all the results here, but I will provide you with our concluding thoughts. Using this novel combination of population ecology, palaeobiology and functional morphology, we highlight how global and regional patterns of mosasaur ecomorphology may have come about and relate these fluctuations to patterns in other groups of marine reptiles. Moreover, our analysis of mosasaur functional morphology tells a cautionary tale about taking global diversity (and disparity) on face value in the lead-up to mass extinction events.

I speak for all the paper authors when I say thank you for reading through this blog – hopefully it has offered more info on this new study and has intrigued you on the biology of mosasaurs. Find the paper here, the 3D models we scanned can be viewed on our Morphosource project here, and look out for more mosasaur-related content coming from the University of Liège EDDy Lab very soon! Until then, Hakuna Squamata!

Uncategorized

Tapirs bite back in the winds of global winter

I have spent a lot of my current academic career staring at tapirs. However, my work has mostly involved postcrania, focusing on forelimbs. This is, ironically, not a field which most tapir workers are familiar with – much of the tapir evolutionary story has been told through the medium of skulls and teeth.
Over the past 2 years, while juggling my work on marine reptiles and dinosaur heritage collections, I have placed one toe very carefully on the bandwagon and been involved in a couple of studies exploring the functional morphology of tapir cranial and dentition. Here I give a brief overview of the first of two studies, which offers some intriguing new insights and interpretations on tapir cranial ecomorphological evolution.

Diagram of facial muscles of a lowland tapir (Tapirus terrestris) by Johan Erik Vesti Boas (c.1925)

Sagittal crest morphology decoupled from relative bite performance in Pleistocene tapirs

This study originated back in 2018. Ms. Larissa Dumbá invited myself and the UAntwerpen FunMorph Lab to collaborate with the Paleozoology Lab group of the Universidad Federale de Minas Gerais (Belo Horizonte, Brazil) in their tapir phylogenetics project. A lot of image data had been collected by the Brazilian researchers, mostly for analysis via traditional and geometric morphometric approaches (see Cozzuol et al. 2013 and Dumbá et al. 2019 respectively). With all those tapir images sitting around not doing anything (and more being taken as part of the phylogenetic study), it seemed daft not to investigate some more functional aspects of tapir morphology – something which has only recently begun to be investigated more rigorously. The principle of the chosen study, which started out as a masters student project for co-author Kim Stoops, was to investigate bite forces across the Tapiridae through time using a very extensive sample of skull photos amassed by the UFMG group. With the introduced impetus of lead author Lisa Van Linden, who worked closely with Kim throughout the project writeup, we pushed forward toward publication, introducing sagittal crest height as a potential covariate for bite-force, and exploring variation across biogeographic realms (Neotropics, Indo-Malayan, Palearctic, etc.).

Distribution of Pleistocene Nearctic and Neotropical tapirs. Hatched shading indicates overlap in geographic range between the species. A picture of a representative skull is provided with the chewing muscles (temporalis in red, masseter in purple). The differences in sagittal crest heights between Nearctic and Neotropical species is shown in the boxplot on the bottom right.

After analysing the 2D images of over 70 individuals of modern and extinct tapir species using the “dry-skull method” for estimating bite forces from skulls, we found a notable pattern of bite force correlating with body size. Though hardly all that surprising, this was the first time this result had been demonstrated quantitatively for tapiromorphs. Within modern tapirs, the Malayan tapir (Tapirus indicus) demonstrated the highest bite forces (again, not all that surprising given its greater size and potential muscle mass), and the smallest species (the recently [and contentiously] described Kabomani tapir T. kabomani) demonstrated the lowest potential  bite forces. All in all, nothing groundbreaking here, but a solid foundation to build on. The strong correlation between size and bite force encouraged us to correct the bite forces for body size and investigate which species had relatively higher bite forces than others – at this point we also brought in phylogenetic  comparative methods to place the results into a more informative evolutionary framework.

Tapir cranial morphofunctional traits (left: absolute bite force; right: relative bite force) plotted onto informal phylogeny

All in all, our results present strong evidence suggesting that tapirs which existed during the Pleistocene epoch exhibited relatively higher bite forces than their predecessors – irrespective of body size and, most intriguingly, independent of sagittal crest height. Well, at least that is the pattern we observed for the specimens and species included in our study! Thankfully, our Pleistocene species coverage for Nearctic and Neotropical tapirs was quite comprehensive – we were only missing 5 poorly represented species out of ~16 known species – and we therefore attach a healthy degree of confidence to our results. The exact ecological drivers behind our findings have yet to be firmly established; it is certainly possible that the drier climate of the Plio-Pleistocene reduced moisture in formerly To learn about the nitty gritty details, we encourage you to read the full article in the journal Integrative Zoology or Lisa’s ResearchGate page.

Uncategorized

Why the long, toothy face? A story of plesiosaurian bimodality

On my arrival at the Université de Liège, I was brought into the fold of an ongoing project concerned with the functional morphology and macroevolutionary landscape of short-necked plesiosaurians. Plesiosaurians (or ‘plesiosaurs’ as many of us will have know them growing up) encompass a large number of genera and species of Mesozoic marine reptiles in the superorder Sauropterygia. Some of you avid readers may be surprised to know that the stereotypical image of plesiosaurs as long-necked, short-bodied and small-headed aquatic hunters is not entirely accurate – sure, there were many long-necked, short-bodied, small-headed species in the group, but there were also a large number of plesiosaurs which went along a different evolutionary pathway. It is this different group – the short-necked, massive-bodied, huge-headed group – which I will tell you about today. And just to make it even more interesting, there are two groups of these short-necked plesiosaurs which came to their similar morphologies quite separately and seemingly independently. Cool, huh?!

…oh, and there are lasers…

An excellent example of the two different types of plesiosaurian. On the left a short-necked plesiosaurian (in this case a pliosaurid) attacking a long-necked plesiosaurian (right). Artwork by Bob Nicholls

The study group for our recently published article were short-necked plesiosaurs – from here on I will refer to them as “pliosauromorph” plesiosaurs. The “pliosauromorph” plesiosaurs include two major phylogenetic clades: Thalassophonea, (part of the Pliosauroidea) and Polycotylidae (an offshoot of the long-necked “plesiosauromorph” plesiosaurs). If you are getting lost in the names, bear with me – I will do my best to keep it simple from here on! Over the years, “pliosauromorphs” have in general been clumped together due to their similar appearance, with their morphology suggesting a certain amount of phylogenetic relationship and a generally similar ecology, i.e. “pliosauromorphs” were probably all occupying a similar role (niche) in their ecosystem. Moreover, the clade containing the largest “pliosauromorph” species (Thalassophonea) have been envisaged for many years as apex predators of their time, with genera such as Pliosaurus, Kronosaurus and Sachiasaurus sporting skulls over 2m in length, armed with teeth up to 11cm in length. By contrast, Polycotylidae (i.e. polycotylids) in general exhibit smaller body sizes, narrower skulls and smaller and more numerous teeth. Could this be a classic example of convergent post-cranial body-plan (bauplan) with divergent cranial shape (and associated feeding guild)? For some time this was inferred to be the case. But there was in fact no empirical investigation into this – it has been accepted as being the case without really being tested in a comparative framework. Enter: the SEASCAPE project from EDDy Lab (Université de Liège).

A comparison of “pliosauromorph” plesiosaurs: (from top left) skeleton of thalassophonean Liopleurodon ferox (Tübingen University; image by Wikimedia user Ghedoghedo); skeleton of polycotylid Dolichorhynchops osborni (Kansas University KUVP 1300; image by Wikimedia user FunkMonk); paleoart reconstruction of a pliosaur and polycotylid (copyright Gabriel Ugueto)

Our study as part of the SEASCAPE project set out to quantify cranial and postcranial morphological features of “pliosauromorph” plesiosaurs. Our mission: to develop a protocol to analyse patterns of morphological variation and convergence by using the density of phenotypes projected into a multivariate morphospace to approximate a macroevolutionary landscape. [Sounds complex – let me break it down for you] We aimed to measure multiple features of “pliosauromorph” plesiosaur skeletons (mostly in the skull) which would then be assessed using ordination analyses to explore patterns of variation in functional morphology. In theory, species with similar functional morphologies would group closer to one another in graphical outputs (e.g. principal coordinates analysis). We would then be able to test how many species were occupying specific areas of “morphospace” (i.e. two-dimensional representation of n-dimensional shape space…which in this case boils down to a graph with each point representing a species of plesiosaur). The density of points in a given region of 2D morphospace offers an indication of how frequently this particular suite of morphological characters / functional traits occurs – regions with very high density of points suggests a functional morphology which was evolved over and over [if it ain’t broke, don’t fix it!]. Finally, we hoped to demonstrate how phenotypic densities varied across the phylogenetic tree of “pliosauromorph” plesiosaurs, and see which morphologies evolved repeatedly. Was there only one region of high density, suggesting a single “pliosauromorph” body plan? Were there two peaks (one thalassophonean and one polycotylid)? Or was it more complicated? Here’s how we found out.

Holotype skull of Plesiopleurodon wellesi (CM 2815), laser scanned as part of the SEASCAPE project. Scanned by Rebecca Bennion at the Carnegie Museum of Natural History. Image by Valentin Fischer in ©Meshlab

The method involved the measuring of multiple features on the skull, jaw, and flippers of all known “pliosauromorph” plesiosaurs with remains complete enough for measuring. Some of these specimens were measured from 2D images from published literature or from in-person images…and some were digitised using the EDDyLab Creaform laser surface scanner, which provided some gorgeous models which we will doubtless be using in scientific outreach in the near future! [click here to check them out]. The measurements were then used to calculate functionally informative ratios – for example, the size of the orbit provides a good indication of the visual prowess of the animal, and potentially whether it could negotiate its habitat in low light levels (e.g. Humphries & Ruxton 2002). Unfortunately, not all species had sufficient data available to qualify for further analysis. Our application of a 45% completeness threshold meant that our initial species count of 40 was reduced to 29, which in itself is no small amount (>70%) of the total species coverage for “pliosauromorph” plesiosaurs. We then utilised an up-to-date phylogenetic tree to explore how these functional morphological data were spread across the tree, and whether the morphology matched closely matched intrafamilial relationships; to do this, we used a cluster dendrogram (see below). If phylogeny ≠ phenology, then we would likely be looking at examples of convergent evolution. As it turned out, the cluster analysis hinted at a bimodal (i.e. two-peaked) evolutionary landscape for “pliosauromorph” plesiosaurs, with several taxa which did not fall into the morphological bracket which would have been expected from the phylogeny:

Cluster dendrogram (adapted from Fischer et al. 2020) demonstrating the division between two groups of “pliosauromorph” plesiosaurs (top: longirostrine; bottom: latirostrine) with example taxon bodyplans (artwork by Gabriel Ugueto).
Two highlighted groupings within each cluster flag up the species which are exhibiting divergent cranial morphologies away from their phylogenetic clade (Plesiopleurodon [polycotylid]; Luskhan, Marmornectes, Stenorhynchosaurus, Peloneustes [pliosaurids])

Once we knew there were two main phenotypic groups but with phylogenetic overlap, we conducted a series of statistical tests to tease apart the data and find out exactly what was going on. Firstly, we checked how much statistical support there was for the clusters we recovered in the cluster dendrogram (see above) [spoiler alert, they were significantly different!]. Secondly, we used both principal coordinates analysis (PCoA) and non-multi-dimensional scaling (NMDS) to generate 2D morphospaces accounting for the largest proportion of shape variation in the sample. Using the phylogenetic tree, we converted the morphospaces into phylomorphospaces (see below), and applied a kernel 2D density estimator to project phenotypic densities onto the graph. The result was a 2D phylomorphospace and a 3D density-based macroevolutionary landscape, both demonstrating two distinct adaptive peaks for the “pliosauromorph” plesiosaur dataset [check out cool 2D and 3D manipulations of the landscape here]. These peaks are generated by specific morphologies: a “latirostrine” (broad-snouted) peak and a “longirostrine” (narrow-snouted) peak:

Adaptive landscape of “pliosauromorph” plesiosaurs. A phylomorphospace (left) highlights the presence of almost exclusively thalassophonean taxa (plus Plesiopleurodon) in the “latirostrine” adaptive peak: elongate snouts with broad bases, large teeth and deep lower jaws). On the opposite side, the “longirostrine” adaptive peak (elongate snouts with narrow bases and numerous small teeth) constitutes almost all the polycotylids, but also several thalassophoneans and early pliosaurids. The 3D macroevolutionary landscape (right) demonstrates that there is a greater density of “longirostrine” species (higher peak), whereas the “latirostrine” peak is broader suggesting more morphological variation in this group. Adapted from Fischer et al. 2020.

The formation of macroevolutionary landscapes for “pliosauromorph” plesiosaurs was not the only result to come out of this study – we also investigated morphospace occupation through time, cranial disparity, and several different convergence metrics. [For full details on these methods, I invite you to read the open access article!] Our results are overall very complimentary to one another: overall morphological disparity exhibited within each of the two phylogenetic groups is comparable (no significant differences), although thalassophoneans exhibit greater cranial disparity (potentially due to their greater lineage longevity (84 Ma for thalassophoneans vs 47 Ma for polycotylids). The application of Stayton convergence metrics to a series of inter-clade morphological groupings (e.g. Trinacromerum + Luskhan + Marmonectes; see dendrogram) recovers evidence of significant convergent evolution in the majority of species groupings. Traits of the postcranial skeleton of both groups seem to be evenly distributed, i.e. these do not greatly influence placement in morphospace, nor does it greatly affect phenotypic density. Snout width was a major player in establishing the bimodal landscape, and may also be considered as an ecological signal; the width of the snout provides a proxy for the size of prey that may be ingested, offers a proxy for mediolateral bending resistance (e.g. during tearing or thrashing of prey), and when coupled with snout length offers an indicator of how much water would be displaced during mouth opening / closure. Latirostrine “pliosauromorph” plesiosaurs (by definition) have broader snouts, and would therefore be capable of ingesting larger prey items – the trade-off would be the necessity for greater muscle mass to counteract drag during biting. For longirostrine species, the effect of drag on their long and narrow jaws would have been much lower, and therefore they would have been able to open and close their jaws with less water resistance, albeit to feed on smaller prey items.

A beautiful paleoart depiction of the polycotylid Dolichorhynchops (copyright Brian Engh) hunting for potential prey (fast-moving cephalopods such as belemnites)

All in all, our results recover a pattern of craniodental morphospace occupation of “pliosauromorph” plesiosaurs which is bimodal, being composed of two principal and recurring morphotypes (“longirostrines” and “latirostrines”), which transcend phylogenetic affinities. Transitions between longirostry and latirostry were moderately rare, but involved a significant change of morphology through convergent evolution. This in turn suggests the existence of a pervasive macroevolutionary landscape channeling the craniodental evolution of “pliosauromorph” plesiosaurs – in fact, at this point we should probably accept that our study essentially makes the term “pliosauromorph” plesiosaurs obsolete, because there is no one “pliosauromorph” morphology among plesiosaurs! [#facepalm] Moreover, our results allow us to examine short-necked plesiosaur [it’s back!] bauplan variation through time, and compare our findings with the macroevolutionary histories of other marine reptiles.

Phylomorphospace occupation by different plesiosaur clades through time. Early pliosaurids (red) and thalassophoneans (orange) dominate the Jurassic, with an absence of longirostrine taxa (left side of morphospaces) in the Late Jurassic. Polycotylids (blue) rise to dominance in the Late Cretaceous, coinciding with the decline and extinction of ichthyosaurs. Figure adapted from Fischer et al. 2020

Our method enabled the detection of fluctuations of the (macroevolutionary) landscape through time. The two main morphotypes were already present by the Middle Jurassic (represented by primitive, longirostrine pliosaurids and the earliest latirostrine thalassophoneans). Subsequent evolution repeatedly explored these two morphotypes, indicating the presence of strong and durable morphofunctional constraints. The Late Jurassic marks a chapter in plesiosaur history with no representatives in the longirostrine group (see above); however, this absence may be explained by the dominance of long-snouted ichthyosaurs and thalattosuchians (marine crocodylomorphs) at this time (see Stubbs & Benton 2016). By the Late Cretaceous, the slender-snouted and supposedly fast-swimming polycotylids colonised entirely new regions of morphospace. In actuality, the Late Cretaceous demise of “latirostrine” thalassophoneans resulted in a collapse in the macroevolutionary landscape of short-necked plesiosaurs from a bimodal to a unimodal distribution. The latest Cretaceous short-necked plesiosaurs exploited niches formerly occupied by other highly successful marine reptiles (ichthyosaurs and thalattosuchians), highlighting the effect of early Cretaceous oceanic restructuring as pivotal to the macroevolutionary landscape of plesiosaurs.

But wait! There’s more!

The take-home message of this post should not necessarily be our empirical evidence for the bimodality of short-necked plesiosaur morphology, nor the effect of Cretaceous oceanic restructuring on the evolution of this iconic marine reptile fauna. More importantly, our protocol is easily applicable to any set of taxa for which independent ecomorphological and cladistic data can be gathered – and as such, we hope to see many more applications of this holistic approach to answer questions about evolutionary ecomorphology, phylogenetic influences, and establishment or preservation of macroevolutionary / adaptive landscapes.

This blog has been based on Fischer, V., MacLaren, J.A., Soul, L.C., Bennion, R.F., Druckenmiller, P.F., & Benson, R.B.J. (2020) The macroevolutionary landscape of short-necked plesiosaurians. Scientific Reports 1-12. doi: 10.1038/s41598-020-73413-5

Uncategorized

Doctor? Doctor Who???

It’s over. It’s done.

After just over five years, I successfully defended my doctorate at the end of April. With all the drama of family visiting, movies to catch up on and general other bits and pieces to sort, I was unable to write much on this subject at the time. So here is all I have!

The actual recorded presentation can be found (hopefully…) if you click here. As for the rest, I think it is most appropriate to provide an excerpt from my thesis acknowledgements – as the real heroes are the ones who kept me going and/or continued to allow me to study when I was falling off the proverbial wagon. Enjoy!

From the start of my failed Skype interview for the doctoral position at the FunMorph lab, it became abundantly clear that this was not going to be a conventional PhD…at the heart of it was a fundamental clash of styles and experience. There was no conceivable reason why it would work. The fact you are reading this right now is evidence that such clashes need not lead to failure. And for that, my supervisor Sandra Nauwelaerts needs the highest of acknowledgement. The success we have achieved in spite of our very different styles, thought processes, knowledge bases and ideas for the project is a credit to Sandra as a supervisor; she worked to mould the brash and somewhat irritating past-Me into a researcher who understands WHY he is doing something, not just WHAT he is doing. This is probably the greatest gift a supervisor can offer to their student, setting them up to work independently and (with any luck) to know what they are doing in a terrifying post-doctoral landscape!

“Who’s the guy with all the dance moves?” “Oh, that’s the head of the lab…it’s a fun lab”. Rolling back the clock to November 2013, Peter Aerts asks me straight away “do you play a musical instrument?” Immediately, I could tell that this guy had a ‘different dynamic’ to the professors and academics who I was more used to! And I don’t think we at FunMorph would have him any other way. Peter has an infectious enthusiasm for everything he does, and his balance of wonder and wisdom is something that any student under his tutorage should aspire to.

pinch
Tapirus pinchaque (based on photo by Eric Kilby)

Research Family: Funmorphidae

Gilles De Meester and Diego Falico – The intricate combination of Gilles’ tact, my bluntness and Diego’s hilarious insights on the Belgian Experience has led to more laughs, lectures and (for want of a better word) “good ideas” than I could ever have dreamt of for my final doctoral years. I feel sorry for most people reading this, because frankly “you had to be there” for most of this stuff – but for what it’s worth, these two have contributed to the best years of my life as an academic. Glenn Borgmans – I challenge any lab in the multiverse to fit this much useless yet fascinating information into one (freshly graduated) doctoral student. He is one of a kind, and I look forward to growing old hearing more pointless facts from him, my Bordeaux Bro (don’t ask…). Simon Baeckens, his support and assistance with work and leisure have been invaluable. I covet his most excellent hair. May he remain a constant source of great amusement, knowledge, common sense, and (of course) smoskes for all. Menelia Vasilopoulou-Kampitsi, her refreshing Mediterranean attitude towards all things really added an extra dimension to the lab while I was there. I will not soon forget her culinary delights, inspiring artwork, knowledge of the bars of Antwerp, and her hilarious outbursts at reviewer comments. Mariëlle Kaashoek, so many fun times with the perissodactyl posse, mostly relating to re-animating dead things and ending the day covered in horse carcass #phdlife. My only regret is that we have not have worked closer on combined perisso-projects – but never say never! Charlotte Van Moorleghem, my good friend, there are few people in my life who can sit patiently watching a guy playing golf without ball or club, talking to himself about some problem with R (lets face it, I always have a problem with R), and yet without saying a word she is able to help. It’s like magic. Jana Goyens, my first room-mate, and an ever-present voice of reason. Jana probably has one of the best perspectives on how I have changed through my doctorate – I would encourage her to keep that opinion to herself for the good of my academic career! Chris Broeckhoven, although our time together in the lab has been brief, I immediately sense that we share many interests, and I believe collaborations and Game of Thrones discussions over a bottle or two of excellent South African wine are fixed in our futures! Emina Šunje, every great lab needs an agent of chaos; a perennial tornado delivering babies, salamanders and casual violence. She can never be accused of not being entertaining! Francois Druelle, my French Connection, the combination of his misunderstood musical taste, delightful edible treats, unwillingness to give up on a point at squash, or the way he says “baboon” (don’t know why, just love it!) has contributed to so much fun in the lab in my final years. Sam Van Wassenbergh, senior-most of my first generation room-mates! Sam’s stalwart dedication to one single carbonated beverage throughout my time at the UA should be an inspiration to us all. Jan Scholliers and Jorrit Mertens, suffice it to say that without these guys I would be one or two chapters short of a thesis – their assistance with logistics is rivaled only by their dedication to the lab as a whole, providing lunchtime food for the needy, endless entertainment, and just great comradery. Raf Claes, pretty much the first non-supervisor I spoke to at any length during my PhD! It has been a pleasure to see him conduct his masters and PhD studies in FunMorph, finalising both before either Glenn or I had defended our PhDs…that should give anyone an impression of the work this guy puts in. Alex Vezyrakis, not sure he’s been at FunMorph long enough to earn a spot in the Acknowledgements…oh ok, go on then. As with all visiting researchers, I am certain his time in Belgium will be too brief, and I sincerely hope he enjoys himself sufficiently to want to return to continue his academic career. Falk Mielke, though he is in a veterinary office far from the madding crowd of Building D, this guy is FunMorph through and through. With wisdom, humour and occasionally overcomplex terminology (yeah, because I never do that…), this guy has been a revelation in the lab, and I trust he will continue to push boundaries for the foreseeable future!

Now then, whoever you are reading this (yeah, YOU!), if a lab group tells you that their secretary is the best, kindly inform them that they do not have a sufficient sample size, and are likely to be incorrect – if they need proof, then they should ask anyone from UAntwerpen FunMorph / BECO groups to point them toward Room D.1.36, the Boss Room (Legend of Zelda reference). Josie Meaney-Ward, ‘The Boss’ (capital T, capital B), my source of tuck-shop chocolates, first port of call for issues, and the keeper of the keys to unlock everyone’s potential. Her ability to make sure that everyone in the lab(s) has the funds they need to conduct their PhD to the best of their ability is an invaluable skill, and one which I am sure to miss in future endeavours. I am glad to have been able to share the lab with her, and I wish her and all of her FunMorph brood the very best for the future.

hypo.png
Hypohippus (based on artwork by Heinrich Harder)

Research Superfamily: Funmorphoidea

Nolwenn Fresneau, too much fun has been had between us to sum it up in a sentence or two – all I will say is that she has been an inspiration for me to keep going, never give up and never give in, and the rewards will sort themselves out. Lotte Oosterlee and Lisa Baardsen (and Krijn Michel and Diana Samuel), for dragging me kicking and screaming out of my comfort zone of Wilrijk and into town on more than several occasions, I thank you all. My social disability has been at least partially relieved thanks to you all, and no words can adequately sum up how much that has meant over the years – so I’ll keep it simple: cheers! Maaike Griffioen,  Whether it be chilling with wine and horror-films, or just being there as a colleague and friend during times of great PhD strife, she has my thanks and I wish her all the very best for the completion of her doctorate! Alexia, Arne, Bert, Gerardo, Laura, Manrico, Marwa, Natalie, Simone, Stijn, and everyone else I’ve not named – so many happy memories in and out of the lab have come about and they have been part of them. They all have my thanks for making the strange and peculiar city of Antwerp become my home-from-home, a home I will be reluctant to leave and in a hurry to return to!

Some special mentions now. Several are obvious. Some are not. They all matter.

Hester, Eleni, Wouter, Paul and Karianne, my students (one way or another), my minions, my helpers in many things. Without your scanning assistance, model reconstructions, and willingness to wander off in museums to find fun things to scan, my project would be so much the poorer. Should you choose to continue, I look forward to following your careers in academia in the future. Thank you all so very much.

Dr. Mark Jervis, my Bachelor’s thesis supervisor. Mark was a wonderful, sarcastic and smiling fellow, who always gave us handouts the size of a small encyclopedia, and then proceeded to tell us the questions he would set on the exam. He was also the only researcher at Cardiff University in my year who was looking into aspects of vertebrate palaeontology and evolution. Without Mark allowing me to pursue a project on vertebrate evolution (cetaceans, if anyone was wondering), I would not have come across geometric morphometrics as a method for quantifying fossil and extant morphology. I may never have then gone on to use GM in my Master’s, and ultimately my journey to Antwerp may never have been paved. The late, great Mark Jervis laid the first academic cobble on the street to where I am now. Thanks Mark.

As both Gilles and Diego (and Mariëlle, and Sandra…) can testify to, I play my music quite loud. For this, I apologise here and now. Irrespective of volume, there is one piece of music which has influenced me through my PhD more so than any other. It is no exaggeration to say that more than half of my research chapters were written to this albumn. And I suspect two thirds of the people reading this will never have heard of it. But, as it has been such an enormous part of my life for the past five years, it would be remiss of me to not acknowledge the genius of Hans Zimmer and his soundtrack to the film Man of Steel. Listening to it, you might even believe that a man can fly…

indicus
Tapirus indicus (based on photo by Tom Van Deuren)

Back to thanks of a more academic nature, there are a great number of people to thank from institutions which I have visited / collaborated with. Therefore, I extend thanks to:

AMNH; Eleanor Hoeger, Jin Meng, Ruth O’Leary (American Museum of Natural History).

ETSU / GFS; Chris Widga, Steve “Wally” Wallace (East Tennessee State University and General Shale Museum at Gray Fossil Site).

FLMNH / UF; Richard Hulbert Jr., Bruce MacFadden, Jeanette Pirlo, Natasha Vitek, Lauren Gonzalez, Paul Morse, Sean Moran, Sharon Holte, John Bloch (Florida Museum of Natural History).

GMH; Michael Stache, Frank Steinheimer, Oliver Wings (Geiseltalmuseum Halle).

KMDA, Francis Vercammen and all Antwerp Zoo and Planckendael staff (Koninklijke Maatschappij voor Dierkunde van Antwerpen).

MCZ; Brianna McHorse, Stephanie Pierce, Jessica Cundiff (Harvard Museum of Comparative Zoology).

MEO; Luc Tyteca and Leentje Vandenhoudt (MuseOs Natuurhistorisch Museum).

MfN / ZMB MAM; Christiane Funk, Stefan Bock, Thomas Schossleitner, Frieder Meyer (Museum für Naturkunde Berlin).

MNHN; Guillaume Billet, Josephine Lesur, Alexandra Houssaye, Christophe Mallet (Museum National d’Histoire Naturelle).

MVZ; Chris Conroy, Marisa Fong (Museum of Vertebrate Zoology)

NHMUK; Pip Brewer, Roula Pappa, Jerry Hooker (British Museum of Natural History)

NHMW; Frank Zachos (Naturhistoriches Museum Wien).

NMS; Andrew Kitchener (National Museums of Scotland).

OMNH; Nick Czaplewski (Sam Noble Museum / Oklahoma Museum of Natural History).

RBINS; Thierry Smith, Annelise Folie, Terry Walschaerts, Sebastian Bruaux, Olivier Pauwels (Royal Belgian Institute for Natural Sciences).

RMCA; Wim Wendelen, Emmanuel Gilissen (Royal Museum of Central Africa).

RMNH; Pepijn Kamminga, Steven Van der Mije, Marianne Fokkens (Naturalis Biodiversity Center).

SMNK; Eberhard “Dino” Frey (Staatliches Museum für Naturkunde Karlsruhe)

UCBL / FSL; Emmanuel Robert (Université Claude Bernard Lyon-1)

I also extend thanks to researchers who have provided me with raw data or offered helpful discussions regarding their own work: Larisa De Santis, Luke Holbrook, Jerry Hooker, Christophe Mallet, Bruce MacFadden, Brianna McHorse, Aaron Wood

Last, and by no means least, the people closest to me.

Carol, Dan, Pete, Judy and Ceal – these guys have always been so supportive of the work I have been doing, without me necessarily explaining it particularly well! Their help, well-wishes and enthusiasm to learn what I am up to have been inspiring, and I thank them all so much for it. I’m sorry none of them could make the defense, but I know they were with me in spirit…non-alcoholic spirit, that is…

Heleen – This little lass came into my life during the calm before the storm, and yet she rose to the occasion as the metaphorical hurricane made landfall. She kept a cool head when I was stressed, offering me opportunities to get away from it all and relax precisely when I needed it most. Heleen’s constant support in this has spurred me on to make the very best version of this thesis I can, and in turn become the very best version of myself. Heleen and her family have been amazing, especially these last doctoral months, and I hope that I can repay their patience with a lot more quality time now the storm has passed. I cannot thank her enough. Love you.

Mum and Dad – when I told them I had been offered the position here in Antwerp, it seemed as though they couldn’t wait to get me out of the house! Ironically, for that I cannot thank them enough. I would have just made a mess if I had stayed at home much longer. Ultimately, I know they just wanted me to come here so they had an excuse to visit and eat chocolate while I was at work! Whatever their reasons, I owe them so much for supporting my decision. I love what I do, and I think I’m kinda good at it, and I wouldn’t have had the opportunity to find that out without them nudging me out the door. Love you.

Thank you all for reading to the end – unfortunately this isn’t Marvel and there isn’t a post-credit scene. But I do want to thank you for taking the time to read through my acknowledgements, because every PhD is a team effort, and these were my squad. Cheers!

bairdii
Tapirus bairdii (based on photo by Greater Los Angeles Zoo Association)

Publication, Uncategorized

Horsing around

If there is one thing which I really missed out on and regret about my PhD, it is that I was unable to truly collaborate with the other members of the perissodactyl research group within the FunMorph Lab. My PhD supervisor, dr. Sandra Nauwelaerts, was (and remains) an expert in equine locomotion and biomechanics. Sandra’s other student, dr. Mariëlle Kaashoek, wrote her PhD on the joint kinematics of equids, with some overlap which included tapirs but nothing which could really be called an “opportunity ” for genuine collaboration. And Sandra’s promoter (and now my post-doctoral supervisor) Professor dr. Peter Aerts, who is a world renowned biomechanist and functional morphologist, was involved in my project whenever we needed biomechanical clarification and insight, but essentially allowed Sandra to supervise me autonomously. It all worked – there was no need to rock the boat – but on seeing the interplay and collaboration between other members of the FunMorph lab (the “lizard people” as most of them are affectionately called [by me and others]), I couldn’t help but think on what might have been…

And so, it is with great pride and enjoyment that I can announce that the collaboration woes have been vanquished! Throughout the rather disappointing years of 2020-2021 (virus, masks, no colleagues, no holidays, etc.), we have been working on a book chapter for a volume on equids published by Springer, covering their ecology, evolution, behaviour, human interactions – essentially everything there is to know about equids! Here we can give you all a sneak peek at our book chapter: Evolution of the Equid Limb.

“The Marsh Series Revisited”, adpated from Kaashoek & MacLaren et al. (2023). Here we see a composite cladogram depicting the major changes in locomotor anatomy through equid evolution, with some very specific and important changes also highlighted (pad-foot to spring-foot; tridactyly to monodactyly). Time is represented along the left of the figure, with numbers representing millions of years before present.

Anyone who knows anything about horse evolution will have come across the “Marsh Series” at some point. They may not have recognised it as such, and perhaps it was not specifically called that, but it will be there in a lot of Biology textbooks for 1st year undergraduates. It was in mine for sure! For me, there is a lot to like about the Marsh series – yes, it is phylogenetically inaccurate in the face of modern cladistic scrutiny; yes, it is a painfully simplistic version of a much more intricate and divergent locomotor transition; but at its heart, no – it’s not actually anatomically inaccurate! Horses (or as I will now more accurately refer to them, equids) underwent an anatomical transition from possessing four toes on their front limbs (as modern tapirs do – yay, tapirs!), through various stages of digit reduction and limb musculoskeletal specialisation throughout the majority of the Cenozoic, with the remaining equids surviving today (all in the genus Equus) possessing a monodactyl (one-toed) foot on both fore- and hind limbs. Now, there are a number of things to factor in here before we delve into how our book chapter deals with this evolutionary transition.

Thing No.1: modern equids are monodactyl, and their genus (Equus) has been around for around 4 million years (Ma). There were also other monodactyl species of equid before Equus (and alongside them) for many millions of years – so Equus was not the first genus to become functionally monodactyl on all four feet. Frankly, equids themselves are not even first mammals to do so – that title goes to the proterotheriids, a group of South American Native Ungulates (SANUs), who achieved this feat in the early Miocene (~20Ma). Anyway, the point is that modern Equus species like donkeys and zebras are the survivors of a monodactyl legacy twice as ancient as hominid bipedalism (i.e. they had one toe before we were walking upright!), and at the end of the day they are not unique in having a single functional toe on each foot.

Thing No.2: Of all the genera of equids that have ever existed, over 80% of those currently described were tridactyl – that is to say, that 4 out of 5 equids that have ever existed had three toes on each foot, not one. Yes – it is the monodactyl equids (and the modern horse most especially) who are the evolutionary oddballs!

And finally, Thing No.3: we did not write our chapter on the evolution of the equid limb to demonstrate that any one group of equids are better or more successful than any others…in fact our base assumption is that through the millennia, equids have been well adapted for their respective habitats and locomotor needs – if you think about it, if they had not been well adapted then (by the rules of Darwinian evolution) the “fittest” they would not have been, and “survived” they would have not! With this key notion in mind – i.e. that equids have never truly been maladapted for their environment – I will endeavour to break down our major argument for the evolution of monodactyly in equids (and, come to think of it, the evolution of monodactyly in any group). We call it the Equal Strength Synthesis, and I will now explain why.

Without delving too much into the physics of movement, here is a brief summary of what you need to know to follow our concept. I use the term ‘concept’ quite deliberately – we base our argument on an idealised condition to make things a bit easier to follow. All the logic behind our synthesis can be found in the chapter (link here), and is rooted in well established biomechanical theory. We use a working example of a “monodactyl Mesohippus” to demonstrate the benefits for an organism (under certain selective pressures) to reduce their number of toes and, in the case of equids, become monodactyl.

Stylised example of a tridactyl Mesohippus (left) and a hypothetical “monodactyl Mesohippus” (right).
Artwork by J. MacLaren, after original painting of Hypohippus by Heinrich Harder

Our concept is very much an update and synthesis of two well-established ideas surrounding horse limb evolution: the Body Mass Thesis and the Locomotor Efficiency Thesis. Broadly speaking, the Body Mass Thesis dictates that a single cylindrical limb bone (e.g. a metapodial) of mass X will be stronger than two or more limb bones of total mass also X. Essentially, having one single metapodial makes the distal limb stronger in compression during loading (e.g. while walking, running or jumping). The Locomotor Efficiency Thesis suggests that the reduction of the distal limb mass (by reducing the limb to a single digit) and the adoption of a highly efficient elastic recoil mechanism (the “spring-foot” apparatus) combined to enable horses to move around at low and medium speeds with high energetic efficiency. Our Equal Strength Synthesis posits that horses have always been strong enough to support their limbs during performance locomotion (e.g. running to evade predators, jumping over obstacles etc.) – so our calculations start off by assuming a STRENGTH of X, rather than a MASS of X.

Here we put together an applied example of the Equal Strength Synthesis. On the left, the three simple cylinders represent a tridactyl horse limb, with side-digits filled in (based on observations of tridactyl equid metapodials). Two simple monodactyl limbs are then presented, one based on the ‘equal mass concept’, and the other based on the ‘equal strength concept’ . We then calculated out the masses and stresses for the simple horse limbs, showing that a monodactyl digit with the same STRENGTH as a tridactyl limb will in fact have up to a 35% reduction in mass!

When the calculations pan out, our simplified single distal limb bone with equal strength as the combined strength of three distal limb bones turned out to have ~30% less mass while maintaining the same length and safety factor! That 30% reduction in mass would significantly benefit the efficiency of locomotion by reducing distal inertia, but also would enable the animal to elongate the limb bone to increase stride length and still be just as strong in compression (though less resistant to bending – there always remains a tradeoff). As a result, our Equal Strength Synthesis represents a biomechanically rooted solution which may explain how equids were able to remain so very successful through such a radical morphological transition. Rather than living on the “edge of failure”, tridactyl equids moved around their respective ecosystems with limb morphologies which had been selected for maximum strength while expending minimal energy during both ordinary and performance locomotion.

With changing ecosystems and associated shifts in diet, body size and ranging behaviour, the strength requirements for the distal limb of equids also shifted, and a single digit became more favourable. The mesaxonic limb of perissodactyls (including horses) made this extreme digit reduction possible – that’s one reason why we don’t see monodactyl members of non-mesaxonic ungulate groups such as giraffes, antelopes or deer today! That said, the same equal strength synthesis concept applies to a multitude of animal groups, including (but not limited to) artiodactyls, notoungulates, macropods, and even ratites! We hope our strength-based approach will prompt discussion and promote greater understanding of digit reduction through time in multiple groups, including iconic taxa such as horses.

Miocene horses from “Doll Ponies” exhibit © Corbin Rainbolt

The book we contributed to “The Equids: A Suite of Splendid Species” is available now from Springer Nature Fascinating Life Sciences series. Our chapter is Chapter 13: “Evolution of the Equid Limb“. We hope you all find it interesting, and don’t forget to check out all the other great work done in this must-read volume on horses, their relatives, their biology and their evolution.

Publication

Changing the face of Brachyodus

I will be the first to admit that I know very little about a lot of ungulate groups! Performing a PhD on one of the most enigmatic groups of hooved mammals (the tapirs) did not prepare me for the myriad of different forms of hooved mammals which lived before, alongside, and after many of my study animals. Thus, when it came to identifying a mysterious skull which was sat on the bottom shelf of a display cabinet in the Evoution and Diversity Dynamics lab of the University of Liege, I was a little stumped. Our older records initially suggested “a rhino”, and some more recent records stated “Anthracotherium“. In fairness, the latter identification was much closer to the mark! Little did I know at the time, but the skull which had been neglected for years and left at the bottom of the pile turns out to be a very special find.

Mystery skull moved out of the shadows and onto the table in preparation for laser scanning

Having established that this skull was pretty cool (look at those chompers!!), I set to a literature search to try a preliminary identification. Cranium-wise, I couldn’t find anything similar, and at the time my assumption was that the cranium and mandible are from the same individual. I had more luck with the mandible, which bore a striking resemblence to the near-complete mandible of Brachyodus depereti (referred to here as ‘Masritherium’ depereti after Fortau 1918). After consultation with the authors of Miller et al. (2014), referal to Brachyodus (sp. indet.) was favoured, and at that point I put little thought to the matter. The important thing was that we had a cool anthracothere in the collection, and as a very well preserved 3D specimen it seemed a shame not to laser scan it! So that’s exactly what I did, and we uploaded the scan to the lab Sketchfab site for the world to see.

Aligned scans of Brachyodus mandible (left) and cranium (right), laser scanned with HandyScanTM 300 ©Jamie A. MacLaren. Each scan is taken and aligned with one another – the different colours in the images represent a separate scan which was then aligned in VXElementsTM software

Enter Dr. Martin Pickford. As a decorated veteran of vertebrate palaeontology across Europe and Africa, Martin has been at the vanguard of anthracothere palaeobiology, palaeoecology and phylogenetic affinity. Much has been made of the potential links between anthracotheres (such as Brachyodus) and the hippopotamids (e.g. modern river hippo Hippopotamus and pygmy hippo Choeropsis). Some have argued that anthracotheres exhibit sufficiently similar cranial and post-cranial features to hippopotamids to indicate that, at the very least, anthracotheres were habitually semi-aquatic (e.g. Orliac et al. 2013), and may have been ancestral to the later hippopotamid lineages. For me, as a functional anatomist, the phylogenetic aspects of anthracotheriids vs. hippopotamids are not of greatest interest or importance; HOWEVER, I do respect that this is a question which raises blood pressures and is very much in need of resolution. Martin and I therefore hope that our new contribution (and associated 3D data) will be used responsibly in the pursuit of phylogenetic resolution for Brachyodus, and Anthracotheriidae in general. And so – to our contribution!

Adaptation of figure from Orliac et al. (2013) depicting Hippopotamus (top) and Brachyodus (bottom). In this reconstruction (based on the fossil MNHT SAF 001; bottom right), the Brachyodus appears very hippo-like, with eyes protruding above the waterline. However, this reconstruction was made without any knowledge of the maxillary/premaxillary region of the skull – something which our new specimen provides.

Our critical description of the new specimen from the collections of the University of Liège (ULg) flagged up some very interesting insights into the skull morphology and composition of the genus Brachyodus. For starters, the chances are very high that the cranium and the mandible of the ULg specimen are in fact not from the same individual – this will need rigerous testing, but as far as tooth-row measurements are concerned, it is highly indicative of two separate specimens. That said, our interpretation is that they do belong to the same species – sadly (for me at least!), that species is already known, so we are not able to describe a new species of the genus. However, the specimens does represent the best known remains of the species Brachyodus onoideus. The diagnosis to this species was made based on dental metrics, in addition to general size and appearence, plus additional key features hitherto unknown for the species. Due to the likelihood that the specimens of mandible and cranium belong to separate individuals, we re-assigned the mandible the specimen number ULg M 5000a (as it is the only part of the specimen labelled with a specimen number in the first place!!), and the cranium is now assigned as ULg M 5000b. 3D models of both specimens can be found on the Morphosource.org online repository, just look for the project ID: 000421549 (“Pickford & MacLaren (2022) Brachyodus onoideus”). The provenance of the specimens is not accurately known – very little information was available for the skull beyond the specimen number on the mandible. Our assessment is that these specimens share colouration, preservation and match the species presence with fossils from the Sables de l’Orléanais from localities in France (Nancray, Chilleurs-aux-Bois); we therefore comfortably attribute the specimens geographically to south-western Europe, potentially central France, during the Early Miocene.

An example of specimens from the Sables de l’Orléanais, figured in Gagnaison (2020), including Brachyodus onoideus (bottom right)

From our description of the new material, we offer two main conclusions which – although in need of more rigorous assessment – provide intriguing insights into the biology of Brachyodus, and potentially anthracotheres at large.

1) The “Semi-Aquatic” Conundrum
A number of researchers have previously suggested anthracotheres are closely related to hippopotamids, and that elements of the skull are indicative of a habitual semi-aquatic ecology in these animals. Our finding of the skull, with its comparatively low orbits (eye-sockets) with no obvious dorsal protrusion – as is seen in Hippopotamus, a high and sharp sagittal crest, and a steeply oriented occipital condyle (articulation between the skull and the atlas, or first vertebra). Let us examine these in turn:

The orbits being placed near the centre of the skull is actually a very common occurence for a number of ungulates, especially those with higher sagittal crests and those which are not habitual grazers. Grazing animals like horses or sheep have elevated orbits, enabling them to retain a good view of their surroundings while feeding with their mouths close to the ground. In Hippopotamus, the orbits are in fact nested within protrusions from the skull, enabling them to peer above the water-line without raising their entire head. As we demonstrate in our study, the orbits of Brachyodus are not anywhere near as elevated as in Hippopotamus – that said, the pygmy hippo Choeropsis does not exhibit protruding orbits, though its eyes are elevated on the skull. The absence of this adaptation to a habitual semi-aquatic existence in the ULg specimens of Brachyodus onoideus certainly suggests that this species / genus was not capable of raising it’s eyes above the water without revealing the majority of the rest of its head!

The high and narrow sagittal crest present in the ULg M 5000b cranium of Brachyodus is raised high above the orbits, and is indicative of quite substantial temporalis musculature in this species. Similarly high crests are observed in semi-aquatic ungulates alive today, such as tapirs; however, possibly the most similar crest morphology among modern ungulates is that of the (very definitely not semi-aquatic) Old World camelids (e.g. Camelus dromedarius, the dromedary)! The height of the sagittal crest does not preclude Brachyodus from being semi-aquatic – many tapirs with pronounced crests spend much of their day in water – but the combination of high crest and low orbits do not lend support to a “Hippopotamus-like” ecology for Brachyodus. Our findings from this study are further supported by a 2021 microanatomical analysis by Houssaye et al. of the long bones of hippos and other ungulates, suggesting that Brachyodus onoideus was maybe, probably, slightly semi-acquatic(!), likely to have immersed itself on occassion, and presumably putting it in a similar ecological category with moose Alces, lechwe / waterbuck Kobus spp., and tapirs Tapirus.

Comparison of skull of Brachyodus onoideus (ULg M 5000a/b) with hippopotamids (top), camelids (middle) and tapirids (bottom).
Hippopotamids: Choeropsis liberiensis (Uwe Gille, Halle (Saale), Germany); Hippopotamus amphibius (DUNUC 1990; based on 3D model available on Sketchfab at https://sketchfab.com/uod_museums).
Camelids: Camelus dromedarius (NHMB 2128; Martini et al. 2018); Tanymykter longirostris (CM 2498; Peterson 1911; Lynch et al. 2020). Tapirids: Tapirus pinchaque (MNHN 1982-34); Tapirus veroensis (UF/FGS 221).
Black line passes through the centre of the Brachyodus orbit, with the two grey lines marking the dorsal extent of the sagittal crest and the margin of the alveoli of the maxillary toothrow – clearly, both hippopotamids’ orbits are positioned well above the black line marked by the orbit of Brachyodus onoideus.

2) How the head was held
As for the inclination of the occipital condyle, this feature is indicative of how the skull is carried on the neck. From previous studies (e.g. Pickford 2015) it has been shown that Brachyodus did not have a short neck like that of hippopotamids and suids, but rather posessed a relatively long neck like many modern-day ruminants (incl. cervids & bovids). The orientation of the occipital condyle in the ULg M 5000b cranium also lends support to the head being held above the origin of the cervical column (i.e. neck vertebrae), and thus may have looked not too dissimilar to a horse or okapi in the positioning of its head and neck on the body.
THAT IS NOT TO SAY that Brachyodus is in any way phylogenetically closer to equids or giraffids than to suoids or hippopotamids!! Simply the carriage of the skull on the neck seems more indicative of ruminant / equine ungulate morphologies than suoid / hippopotamid ungulate morphologies.

Highly speculative reconstruction of cranial appearance of Brachyodus onoideus
Reconstruction by Orliac et al. (2013) based on crushed skull of MNHT SAF 001 (top), compared to life-restoration by MacLaren (this blog) based on 3D preserved skull of ULg M 5000a/b (bottom). Note the continuing lack of knowledge regarding the orientation of the nostrils, but also the clear distinction between the dorsal skull morphology and the region occupied by the eye. ©Jamie A. MacLaren

In this study, we justifiably fall short of assigning any phylogenetic significance to our interpretations based on ULg M 5000a/b – as they are functional and ecological in nature – but we do strongly encourage researchers working on establishing phylogenetic relationships within the Anthracotheriidae or within (Cet)Artiodactyla in general to inspect the specimens at the University of Liège collection, as they may be pivotal in understanding relationships within this much-maligned and hotly debated clade. We hope the reader has wheted their appetite for more info on the Liège specimens – the article can be found in a special issue of Historical Biology commemorating the work of Prof. Jorge Morales, and also a my ResearchGate research page. Spread the word – Brachyodus was almost certainly probably not semi-aquatic in the way researchers used to think!